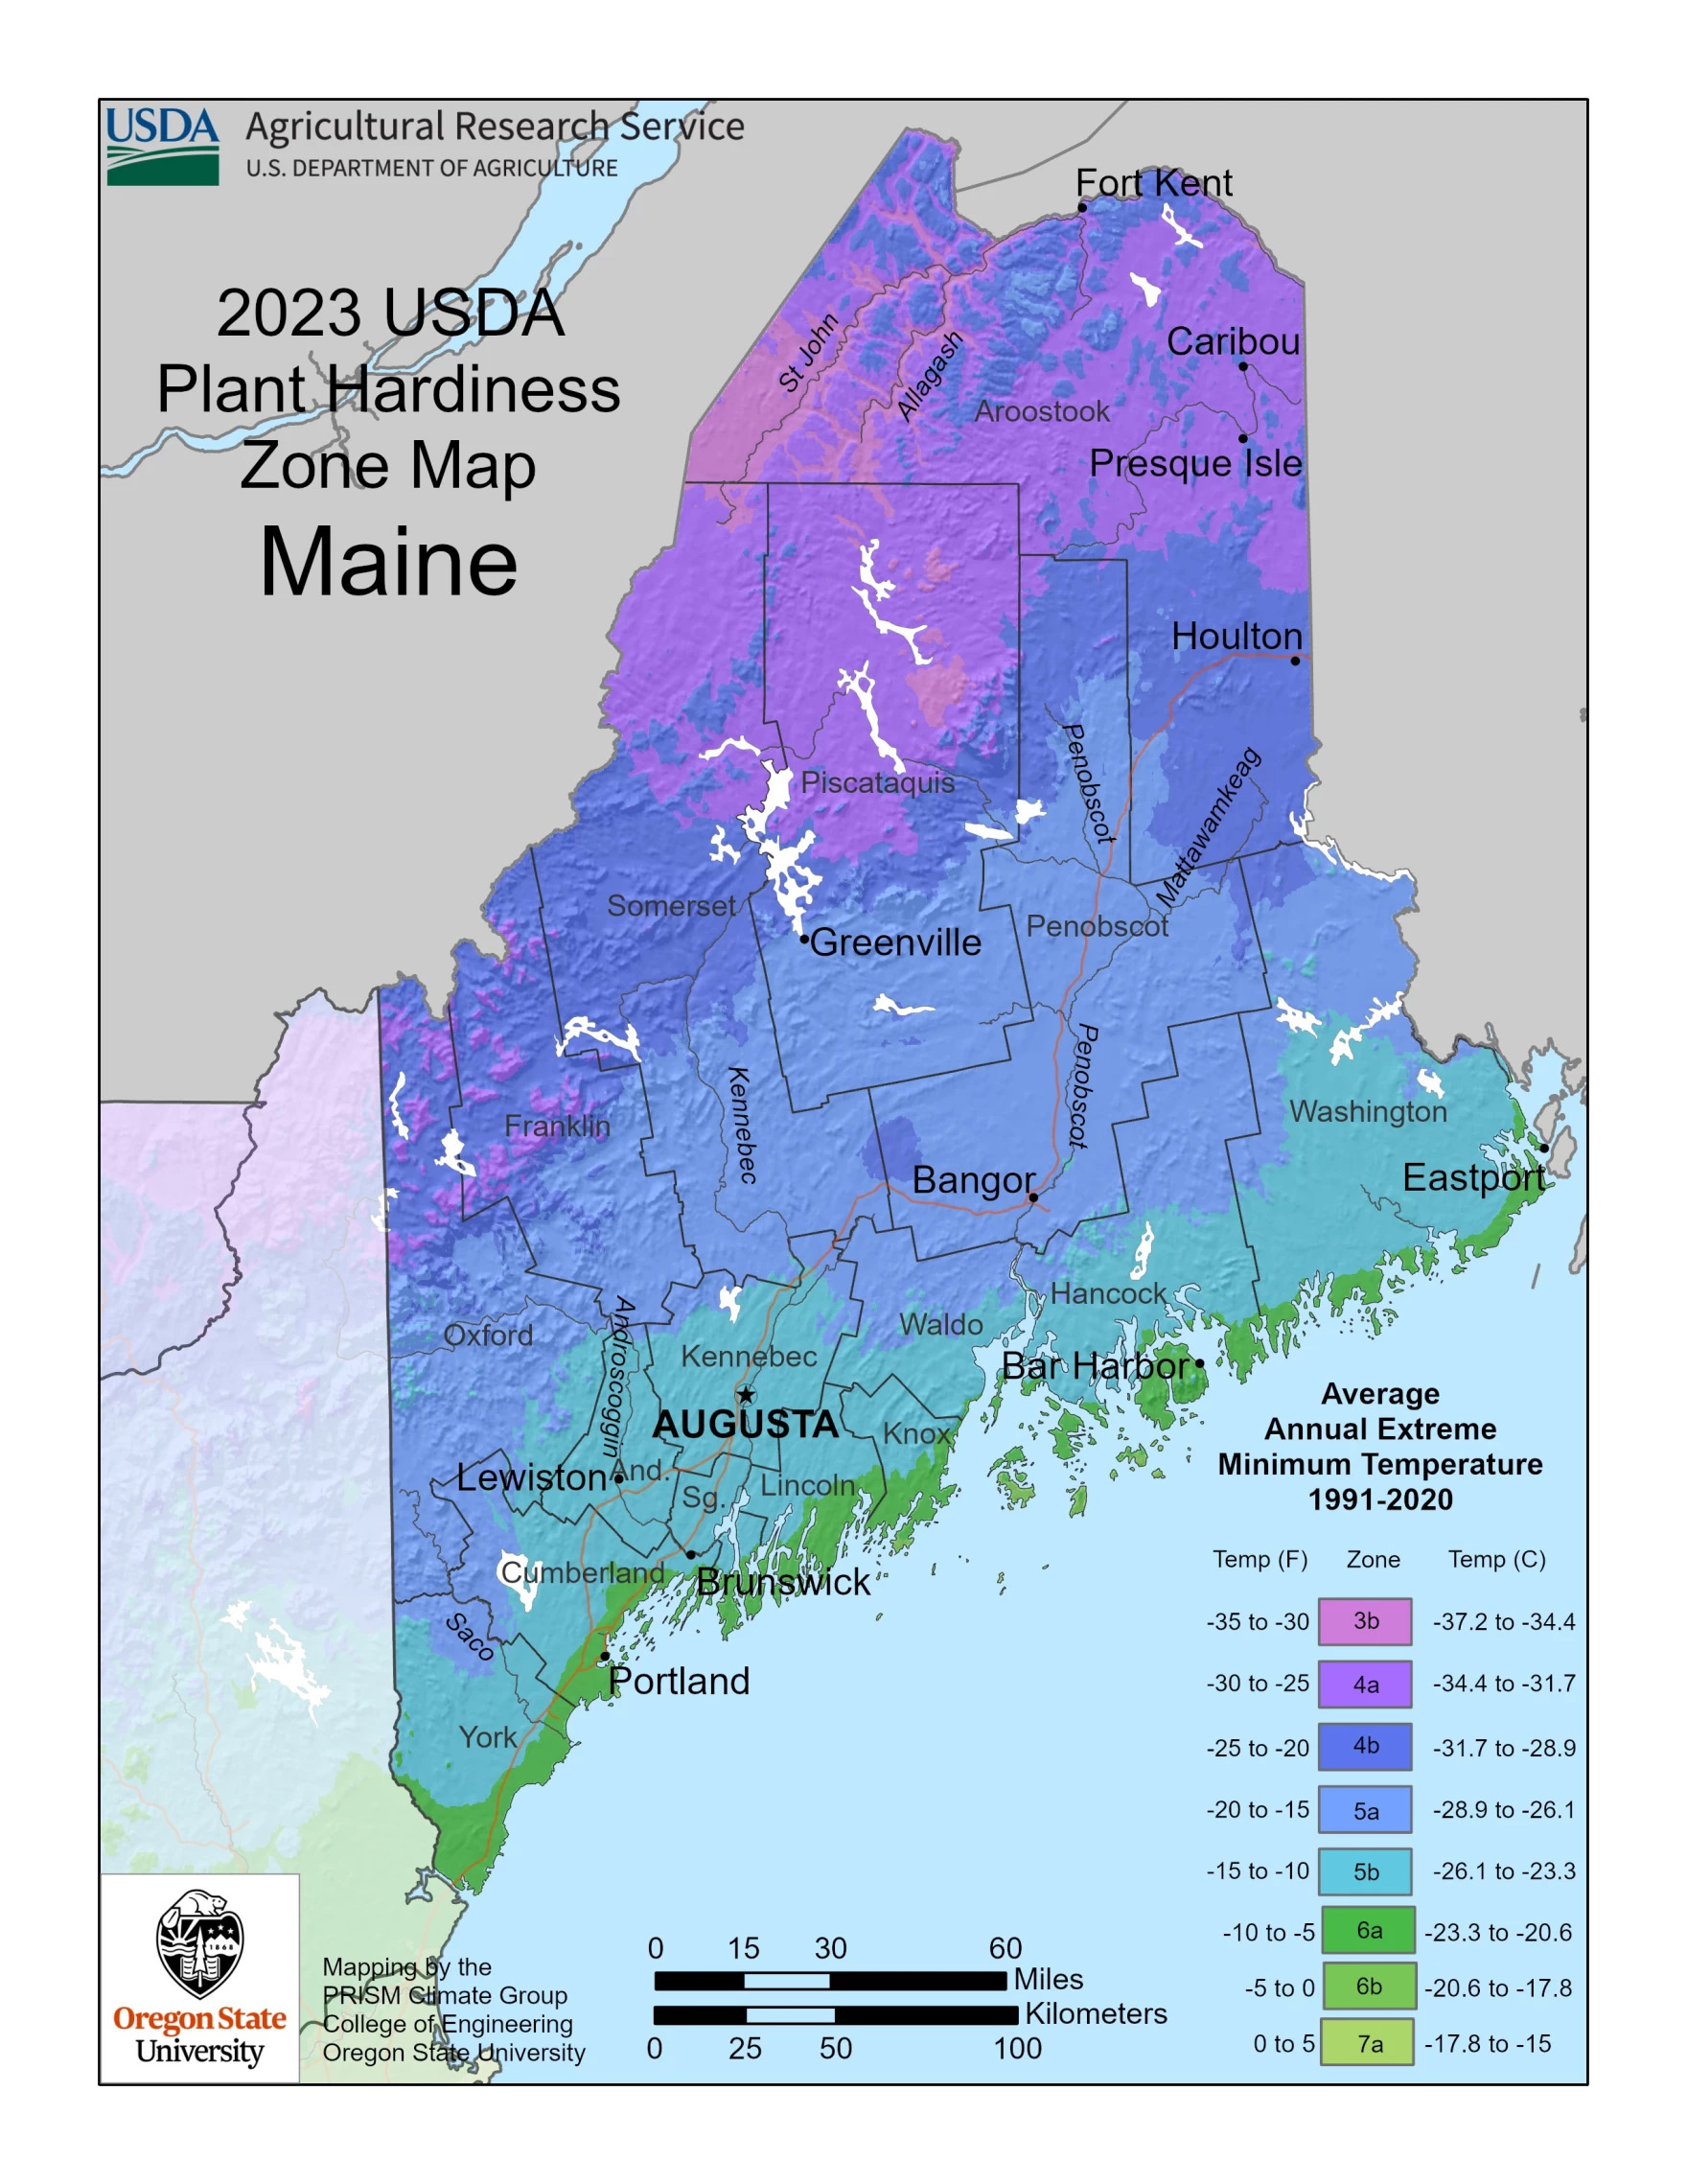
How does this Hardiness Zone Map differ from the old one?
- The new map is based on about 30 years of weather data, from 1991-2020, and the recommendations from a multi-disciplinary panel of experts. This recent data is also being used by climatologists in the field.
- Maine’s temperatures now appear slightly warmer. Part of this “warming” may be a result of higher resolution due to the use of GIS techniques in the new map.
What do the Hardiness Zones mean?
- Maine spans Plant Hardiness Zones 3-6. Each zone is based on the 30-year average of the single coldest temperature recorded each winter. Zone 3 is 10 degrees F colder than Zone 4, etc. In addition, each zone is split in half. For example, sites in Zone 4a reach an average low temperature of -30 to -25 F, while sites in Zone 4b reach an average winter low temperature of -25 to -20 F.


